2024 ANNUAL REPORT
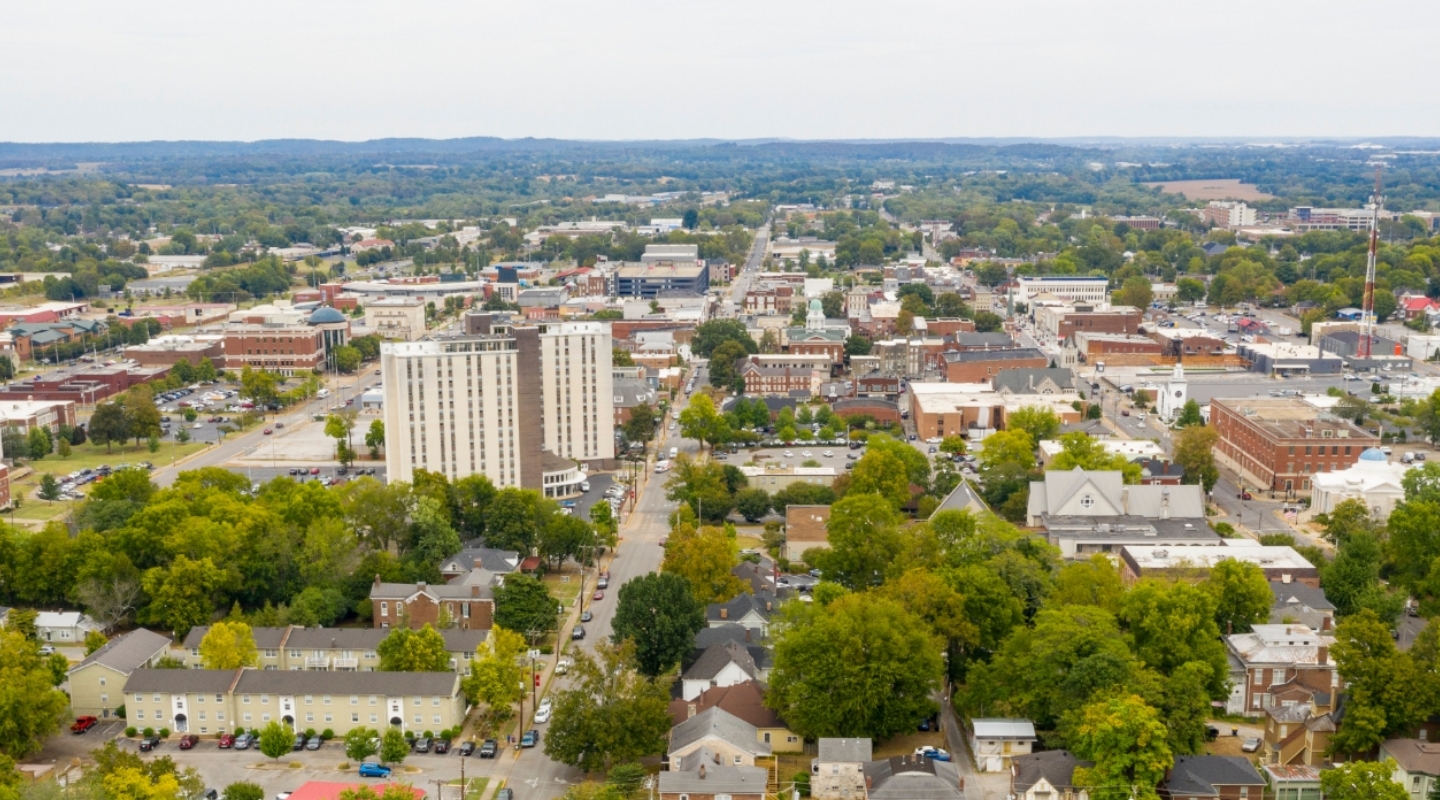
Bowling Green

Economic Indicators1
47.7%
5-year
GDP growth
GDP growth
5.4%
5-year population growth
4.7%
Unemployment as of Dec. 31, 2024
No. 25
in Net
Migration2
Migration2
52.0%
of statewide
moves are inbound
migration3
moves are inbound
migration3
- Source: U.S. Bureau of Economic Analysis, retrieved from FRED, Federal Reserve Bank of St. Louis
- Source: U.S. News and World Report
- Source: North American Moving Services
Communication and trust — Pinnacle Team is a 10 on both!Bowling Green clientHaving a relationship with Ervin Sorrel is very helpful, and I fully trust him to do the correct thing for me.Bowling Green client
Pinnacle Growth
2
Revenue Producers
Hired
Hired
12.3%
Loan Growth to $216.0 Million
58.7%
Deposit Growth to $167.9 Million
No. 12
Deposit Market Share Out of 21 Banks*
Up from No. 15 in 2023
*As of June 30, 2024, according to FDIC data.